Wins and saves are perhaps the hardest to predict of traditional Rotisserie categories, because they depend on so much that is outside the player’s control. A mediocre reliever given the chance to close can rack up impressive save totals, but he can just as quickly lose his job and become another anonymous middle man. Obviously the value of the former is much harder to project than the value of the latter.
Wins are little better, as run support can vary widely even within a team, and when you’re only playing 30 games a year, then sheer luck still plays a large role: Cliff Lee had a very good year in 2012, with 207 strikeouts in 211 innings, and a fine 3.16 ERA that was 7th in the league. Teammate Cole Hamels posted a nearly identical 3.05 ERA in 215 innings, with 190 whiffs. Yet Hamels posted 17 wins, fourth best in the league, while Lee had just 6. A weighted averaging method would project Hamels for several more wins than Lee, even though they’re both probably about the same. So if you’re not looking at previous wins, what else can you do?
My new model for projecting wins starts by looking at the league’s total projected runs scored and runs allowed. I scale runs scored so that the total matches runs allowed, and then I look at a winning percentage estimation method. At first I simply computed a Pythagorean estimate for the team, with the idea that a player’s wins should be the team’s wins times the player’s projected share of innings pitched. But while better starters typically are given the opportunity to pitch more, their edge in wins on average is larger than simply their edge in innings pitched. So I then tried to scale using the pitcher’s own projected runs allowed, and his share of runs scored (assuming equal run support across innings pitched). Eventually I settled on a differential estimator to estimate a pitcher’s winning percentage, using their runs allowed and prorated team runs scored based on his innings pitched. I assumed he gets decisions prorated based on innings also, and thus wins is simply the estimated winning percentage times prorated decisions, and losses is prorated decisions minus estimated wins.
These totals look better: now Cliff Lee projects to about 15 wins, whereas before this adjustment his low total last year left him with just 11 projected wins. As Lee is still striking out plenty of hitters, walking very few, I’m more comfortable with the higher estimate.
For saves, I devised a more complex, and somewhat arbitrary, model. In recent years there have been about half as many saves as wins in MLB, so I start by taking the overall team’s win estimate and dividing by 2. That’s my projected save total for the team, and now the question becomes how to allocate that among the relievers. I came up with an idea of “save shares”, an algorithm to allocate saves among all the pitchers in a bullpen. The idea is that I’ll project saves for players with positive “save shares”, in proportion to the “save shares” each has.
I use three different factors to compute a save share score. The first is relative effectiveness: compared to other pitchers in your bullpen, how well are you likely to pitch? The second is the team-specific depth chart ranking. If a manager pulls a closer, usually the set-up man is the first one to get a shot at saves. So how you rank in the current depth chart is a factor. Finally, for people designated as closers, I rank them by effectiveness also, with the assumption that shakier closers relative to other closers are more likely to lose their jobs than stronger ones.
After adding these factors, I come up with “save share” scores, and the team’s projected saves get allocated to those with positive scores.
These save share scores also are useful when it comes to projecting holds. Like saves, I start out by estimating team-wide holds. Interestingly, while saves have been rather steady at around 50% of wins, holds are on the rise:
| Year | Wins | Holds | Hold Pct | Saves | Save Pct |
|---|---|---|---|---|---|
| 2012 | 2430 | 2328 | 95.8% | 1260 | 51.9% |
| 2011 | 2430 | 2116 | 87.1% | 1243 | 51.2% |
| 2010 | 2430 | 2092 | 86.1% | 1204 | 49.5% |
So for this year I went with 95% of projected wins, which may well be too high, but we’ll see. Now comes the question of how to allocate holds. Well, I had a simpler notion of hold shares. This time I wanted to credit a pitcher for being more effective, so I start by taking the pitcher’s winning percentage times his decisions as an initial share. However, I reduce this by the percentage of a team’s saves I project the player for: if you’re the closer, you get save opportunities, not hold opportunities. So if you get all the team’s saves, I’ll zero out your holds. But to the extent that other pitchers in the bullpen get saves, you may get holds. I have in mind modeling the chances of a closer change during the year. Finally, the more effectively you’re pitching, the greater a share of holds you should get. So I take the winning percentage derived from runs allowed, and use that to determine what percentage of team-wide holds a given pitcher gets.
I think this will be an improvement over using a more traditional weighted average plus mean reversion for these decision statistics.
So who are the projected win leaders?
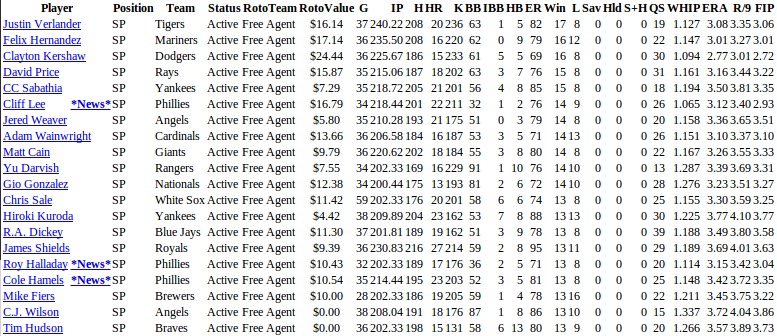
Cliff Lee checks in at 14 wins with strong peripheral numbers, and is actually above teammate Cole Hamels (who was not as strong in 2011 as Lee, and thus projects for somewhat weaker performance). Also Felix Hernandez projects to 16 wins, despite just 13, 14, and 13 in the past 3 years. My model thinks Hernandez will pitch quite well, and has simply been unlucky with run support in past years, and also that the Mariners’ offense is improving at least a little.
The projected leaders in saves:
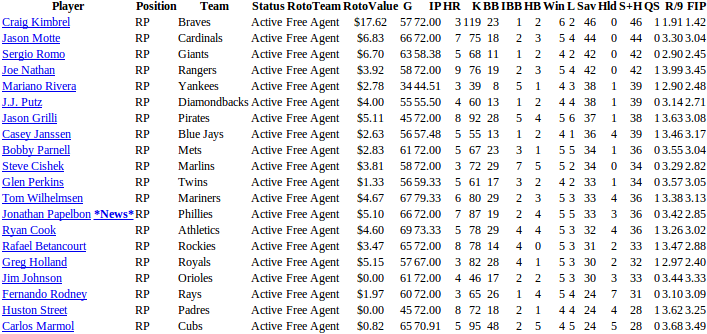
Note that the save leaders project to 0, or very few, holds, which is by design. One thing I did not adjust was win totals for projected closers. Often they’re used only to protect leads, so it’s not uncommon for them to get very few, or sometimes even zero, wins on the year. But managers are using closers a little more in tie games, especially in extra innings. I’d take the under on Craig Kimbrell’s 6 wins, but that probably doesn’t overstate things too much. I was a little surprised to see Jason Motte second, but the rest of the Cardinals’ bullpen does not project well in my system, but the team is expected to win 88 games, so Motte could rack up high save totals. Likewise Joe Nathan in Texas and Sergio Romo in San Francisco appear to have little competition for saves. By contrast, the Tigers lack a proven closer, and initial projections for rookie Bruce Rondon don’t suggest that he will be especially effective. So my model spreads saves around widely in Detroit, with several pitchers projected to have more saves than Rondon, but no one standout pitcher.
One other minor point – for lefthanded pitchers not currently closing, the model reduces any advantage they have over the incumbent closer. I do this for two reasons: first, lefthanders often are used mostly against other lefties, resulting in better raw stats than their talent level would be if facing lots of righties; second, managers typically like to keep a top lefthanded reliever for particular situtations, and so lefthanders are less likely to be given a closer role.
Because wins, saves, and holds are so situation-dependent, I’m uncomfortable simply using past performance in these categories to project future results. So I’m trying a different approach, which I hope should better predict these decision stats.