A bit over a decade ago Voros McCracken made a startling discovery: pitchers have very little control over whether a batted ball in the field of play is a hit or not. He found that for pitchers, batting average on balls in play (BABIP) was largely random. And, more interesting for fantasy players, it varied quite widely. Obviously the number of hits you give up directly affects WHIP, and it also greatly impacts ERA, two of the four standard pitching categories. Further research has suggested that some pitchers who induce particularly weak contact, such as knuckleballers, may sustain lower than average BABIP, and it also shows that BABIP varies somewhat between ground ball and fly ball tendencies (extreme ground ball pitchers have somewhat higher BABIP, although this is largely offset in ERA impact because extreme fly ball pitchers tend to give more of their hits for extra bases).
Still, a good rule of thumb is that if a pitcher has an extreme BABIP one year (and he’s not Tim Wakefield), he’s not likely to repeat it, and thus his ERA and WHIP are more likely to regress towards the mean – rising for low BABIP players, while falling for high BABIP ones.
Batters did show more sustainable differences in BABIP – a slap hitter with speed is rather likely to have a higher BABIP than a slow slugger. But even there, an overly extreme value may suggest the batter has been lucky – or unlucky – and his luck might change.
So I wanted to add BABIP, and the most common formula for batters is (H – HR) / (AB -K – HR + SF). I was wondering why it included sacrifice flies, but not sacrifice bunts. The latter are certainly balls in play, so it initially seemed like they should count. But Tom Tango makes a good case for leaving sacrifice bunts out, so I’m following that for batters.
For pitchers, I’m using the formula (H – HR) / (BF – HR – BB – K – HBP). I suppose this technically includes sacrifice bunts, so I’m being inconsistent. Some of this is because I don’t have data for sacrifice bunts against particular pitchers, so I can’t exclude them easily.
While I could easily find several articles discussing BABIP, actually finding data was harder. Derek Carty pointed me to Fangraphs, which had both batting and pitching data. Thank you, Derek.
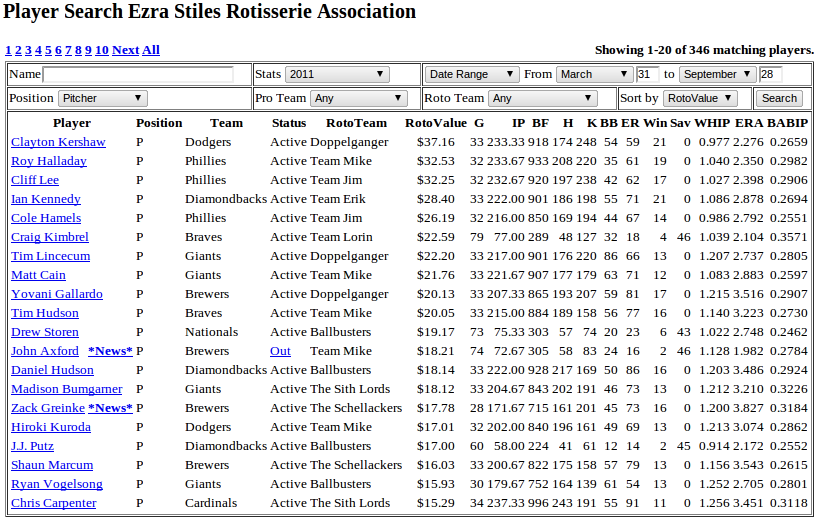
So, here’s a search of the top 20 NL pitchers in a 5×5 league, with BABIP displayed: 
Clayton Kershaw had a great year, but also a much better BABIP than Cliff Lee or Roy Halladay. Cole Hamels had an even better BABIP, while Craig Kimbrell’s was quite poor, albeit in only 77 innings. Madison Bumgarner and Zack Greinke were the highest among starters ranking among the top 20. So naively, we might think Bumgarner and Greinke pitched better than their ERA and WHIP, while Kershaw and Hamels were more likely not quite as good as their other numbers suggest. This is worth remembering when deciding whether to go an extra dollar on these pitchers in next spring’s auctions.