Tom Tango asked an interesting question on Twitter yesterday:
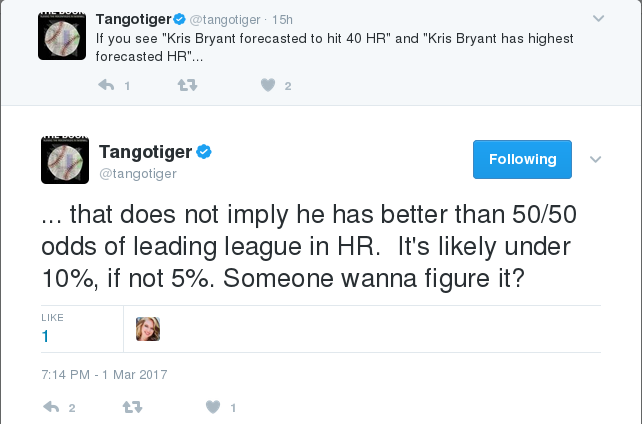
The odds of the projected HR leader actually leading the league is an interesting question. I’ve been doing projections since 2011, so I thought I’d sweep my database for the RotoValue projections and see what that history was. That gives me just five years, but it turns out my projection model did correctly name the MLB home run leader once in those five years, or 20% of the time. Chris Davis hit 47 HR in 2015, leading MLB, while my model projected him to hit 35 HR. Note that when you’re leading the league, you’re not only very likely beating your own projection, you’re also probably beating all the projections, because the projected totals can be considered a weighted average of all possible outcomes for that player, and the possibility of a bad year or injury will pull that average down from what a peak player will produce when healthy. Also it’s not unusual for the league leader to be a player having a breakout year, well above what his past performance suggested.
Last year, Mark Trumbo’s career-best 47 HR topped MLB, despite my model projecting him for just 21.3 HR, the 46th best total. My projected 2016 leader was Chris Davis again, now projected to hit 37.9, and he actually slightly edged that out, with 38 HR. But I was not projecting the overall home run surge, and Davis’s 38 HR ranked only 12th best.
The actual MLB HR leader has regularly surprised my projections model. Only one other year, 2012, when Miguel Cabrera’s 44 HR led, was the actual leader among my preseason projected leaders (my model projected 34.5 HR for Cabrera, the 5th best projection). In the other years, the leader was projected 36th (Nelson Cruz moving to Baltimore in 2014), 90th (Chris Davis in 2013) and 73rd (Jose Bautista in 2011) by my model.
Over the 6 years, of the 60 players projected to finish in the top 10, 22 of them did so. Also, 24 of the 60 equaled or bettered their projected total, while 36 failed to reach the projected value.
Below the jump I’ve put tables for each year showing players projected to be in the top 10 in HR in my model, along with any players who actually finished in the top 10, along with their projected values.
| 2016 |
| Name |
ProjHR |
ProjRank |
ActHR |
ActRank |
| Chris Davis |
37.9 |
1 |
38 |
12 |
| Giancarlo Stanton |
35.2 |
2 |
27 |
47 |
| Mike Trout |
35.0 |
3 |
29 |
38 |
| Nelson Cruz |
33.0 |
4 |
43 |
2 |
| Jose Bautista |
32.9 |
5 |
22 |
78 |
| Edwin Encarnacion |
32.4 |
6 |
42 |
3 |
| Bryce Harper |
29.9 |
7 |
24 |
65 |
| Anthony Rizzo |
29.7 |
8 |
32 |
22 |
| Josh Donaldson |
29.3 |
9 |
37 |
14 |
| Jose Abreu |
29.3 |
10 |
25 |
55 |
| Chris Carter |
27.9 |
15 |
41 |
6 |
| Nolan Arenado |
26.4 |
17 |
41 |
7 |
| Kris Bryant |
25.3 |
21 |
39 |
9 |
| Khris Davis |
24.9 |
22 |
42 |
3 |
| Todd Frazier |
24.4 |
30 |
40 |
8 |
| Brian Dozier |
22.0 |
38 |
42 |
3 |
| Mark Trumbo |
21.3 |
46 |
47 |
1 |
| Robinson Cano |
17.9 |
77 |
39 |
9 |
| 2015 |
| Name |
ProjHR |
ProjRank |
ActHR |
ActRank |
| Chris Davis |
35.0 |
1 |
47 |
1 |
| Miguel Cabrera |
32.2 |
2 |
18 |
70 |
| Giancarlo Stanton |
31.4 |
3 |
27 |
25 |
| Mike Trout |
30.9 |
4 |
41 |
5 |
| Jose Abreu |
30.5 |
5 |
30 |
19 |
| Nelson Cruz |
30.4 |
6 |
44 |
2 |
| David Ortiz |
30.2 |
7 |
37 |
12 |
| Edwin Encarnacion |
29.8 |
8 |
39 |
10 |
| Jose Bautista |
28.6 |
9 |
40 |
7 |
| Adam Jones |
28.3 |
10 |
27 |
24 |
| Albert Pujols |
25.4 |
13 |
40 |
8 |
| Josh Donaldson |
21.9 |
26 |
41 |
6 |
| Bryce Harper |
20.1 |
40 |
42 |
3 |
| Carlos Gonzalez |
18.6 |
49 |
40 |
8 |
| Nolan Arenado |
15.3 |
86 |
42 |
3 |
| 2014 |
| Name |
ProjHR |
ProjRank |
ActHR |
ActRank |
| Miguel Cabrera |
36.0 |
1 |
25 |
21 |
| Chris Davis |
32.9 |
2 |
26 |
20 |
| Adrian Beltre |
31.1 |
3 |
19 |
57 |
| Giancarlo Stanton |
30.5 |
4 |
37 |
3 |
| Edwin Encarnacion |
29.8 |
5 |
34 |
8 |
| Mike Trout |
29.6 |
6 |
36 |
4 |
| Jose Bautista |
28.5 |
7 |
35 |
7 |
| Prince Fielder |
28.4 |
8 |
3 |
320 |
| Adam Jones |
28.0 |
9 |
29 |
12 |
| Adam Dunn |
27.3 |
10 |
2 |
366 |
| David Ortiz |
23.5 |
24 |
35 |
6 |
| Nelson Cruz |
21.0 |
36 |
40 |
1 |
| Chris Carter |
19.8 |
47 |
37 |
2 |
| Anthony Rizzo |
18.1 |
60 |
32 |
9 |
| Victor Martinez |
15.6 |
88 |
32 |
9 |
| Jose Abreu |
14.0 |
110 |
36 |
5 |
| 2013 |
| Name |
ProjHR |
ProjRank |
ActHR |
ActRank |
| Jose Bautista |
34.5 |
1 |
28 |
16 |
| Miguel Cabrera |
34.2 |
2 |
44 |
2 |
| Giancarlo Stanton |
31.9 |
3 |
24 |
31 |
| Ryan Braun |
31.6 |
4 |
9 |
194 |
| Jay Bruce |
30.7 |
5 |
30 |
11 |
| Albert Pujols |
30.5 |
6 |
17 |
80 |
| Josh Hamilton |
30.4 |
7 |
21 |
52 |
| Adrian Beltre |
29.7 |
8 |
30 |
10 |
| Mark Trumbo |
27.8 |
9 |
34 |
6 |
| Josh Willingham |
27.8 |
10 |
14 |
107 |
| Adam Dunn |
26.5 |
15 |
34 |
7 |
| Edwin Encarnacion |
26.3 |
17 |
36 |
3 |
| Adam Jones |
25.0 |
22 |
33 |
8 |
| Evan Longoria |
22.5 |
35 |
32 |
9 |
| Paul Goldschmidt |
21.6 |
44 |
36 |
3 |
| Pedro Alvarez |
18.3 |
72 |
36 |
3 |
| Chris Davis |
17.0 |
90 |
53 |
1 |
| 2012 |
| Name |
ProjHR |
ProjRank |
ActHR |
ActRank |
| Albert Pujols |
40.6 |
1 |
30 |
23 |
| Prince Fielder |
40.1 |
2 |
30 |
23 |
| Giancarlo Stanton |
36.6 |
3 |
37 |
7 |
| Mark Reynolds |
35.9 |
4 |
23 |
52 |
| Miguel Cabrera |
34.5 |
5 |
44 |
1 |
| Jay Bruce |
33.6 |
6 |
34 |
10 |
| Jesus Montero |
33.4 |
7 |
15 |
117 |
| Evan Longoria |
32.3 |
8 |
17 |
97 |
| Dan Uggla |
31.8 |
9 |
19 |
79 |
| Joey Votto |
31.8 |
10 |
14 |
129 |
| Ryan Braun |
31.4 |
13 |
41 |
5 |
| Adam Dunn |
30.3 |
16 |
41 |
5 |
| Curtis Granderson |
26.6 |
20 |
43 |
2 |
| Josh Hamilton |
24.5 |
27 |
43 |
3 |
| Edwin Encarnacion |
22.8 |
39 |
42 |
4 |
| Adrian Beltre |
21.9 |
49 |
36 |
8 |
| Josh Willingham |
19.3 |
72 |
35 |
9 |
| 2011 |
| Name |
ProjHR |
ProjRank |
ActHR |
ActRank |
| Prince Fielder |
42.3 |
1 |
38 |
5 |
| Albert Pujols |
41.4 |
2 |
37 |
6 |
| Ryan Howard |
41.0 |
3 |
33 |
10 |
| Adam Dunn |
39.7 |
4 |
11 |
143 |
| Mark Reynolds |
36.6 |
5 |
37 |
6 |
| Miguel Cabrera |
34.9 |
6 |
30 |
21 |
| Ryan Braun |
34.4 |
7 |
33 |
11 |
| Mark Teixeira |
34.2 |
8 |
39 |
3 |
| Carlos Quentin |
32.8 |
9 |
24 |
43 |
| Evan Longoria |
32.7 |
10 |
31 |
16 |
| Giancarlo Stanton |
32.4 |
11 |
34 |
9 |
| Dan Uggla |
29.3 |
16 |
36 |
8 |
| Matt Kemp |
23.9 |
39 |
39 |
3 |
| Jose Bautista |
19.2 |
73 |
43 |
1 |
| Curtis Granderson |
14.7 |
120 |
41 |
2 |