I’ve run the first version of my 2015 NBA Stat projections. There are two versions, RotoValue and AdjRotoValue.
My model starts with a weighted average of recent performance, adds regression to a per-position mean, and applies an aging adjustment (very young players will, other things being equal, tend to improve, while older ones will tend to decline). The RotoValue projections are the output of this basic model. Here’s the top 20 Fantasy Players by my projections for 2015 in a 9-category league:
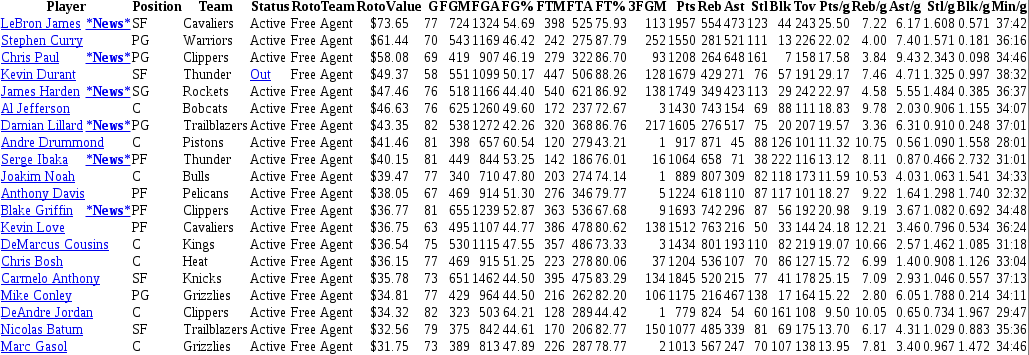 With different categories, the model will compute somewhat different prices, and the ordering can change. Even if you’re in a draft league, the difference in RotoValue prices can be useful, as they give not just an ordering, but some idea of how close players are. LeBron James is very clearly #1 player now that Kevin Durant is expected to be out until mid-December (and his projected numbers are scaled back accordingly). Nobody is within $10 of him in this format. By contrast, Blake Griffin and Kevin Love project to have basically the same value. While Love’s per-game stats are much better, my model projects him for many fewer games, and thus Griffin projects to have somewhat better overall cumulative numbers. Like Love, Anthony Davis is hurt by projecting to miss more games, and so the more durable Serge Ibaka, who projects to lead the league in blocks, is actually the top power forward in this format with my projections. I certainly would understand taking Davis or Love well ahead of Ibaka or Griffin (or spending more for them), but those who did so in the past were often burned by injuries.
RotoValue can let you evaluate players on a per-game basis instead. Just check the “Use per-game RotoValue”, and the page will scale all players’ to playing 82 games:
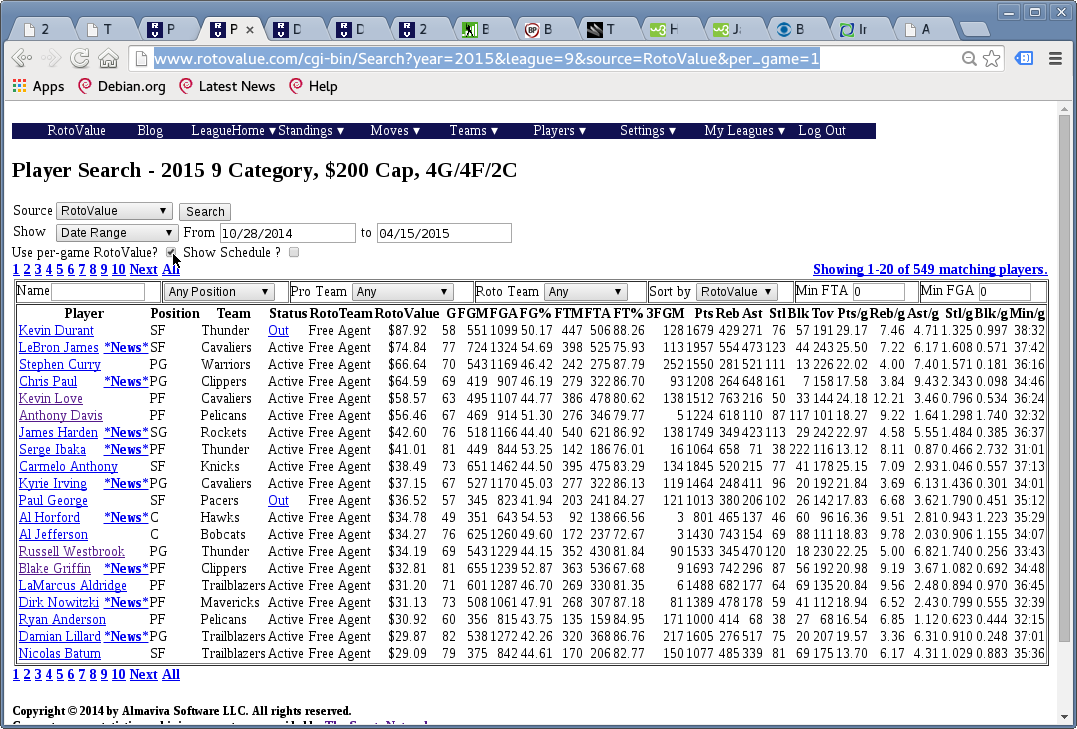 Now Kevin Durant comes out on top, with Love the top power forward closely followed by Davis (both well ahead of Ibaka and Griffin). In addition to the injury risk, Love is moving to a new team where he no longer will be the top offensive option, and so it’s probable his scoring will decline from my projected values. My RotoValue model considers each player in isolation – his projection is based on his historical per-minute averages, his age, and his position.
I’m also running AdjRotoValue numbers, which, for the top 20, are almost identical to the raw RotoValue numbers. For this set, I do adjust minutes played for a team, to make sure each team’s projected total is within reason. If the RotoValue projections for a team have too many minutes, the model will remove minutes from weaker players on the team (but not someone projected to be among the 3 most valuable). Conversely, if the totals are too low, the model will look to add some playing time, starting with better players, to get the team total to an even point. This has an impact on cumulative totals for weaker players, but it reflects the fact that there are only so many minutes on a team. This does not, however, try to account for differences in shot distribution, or role in rebounding, or other factors which might make Kevin Love in particular harder to project for 2015. You can see AdjRotoValue numbers here:
http://www.rotovalue.com/cgi-bin/Search?year=2015&league=9&source=AdjRotoValue
Finally, if you purchase RotoValue Analyst for just $10 for the year, you can save your own projections for players, either entirely or just for a few players (using RotoValue or AdjRotoValue for those you don’t project), and then see RotoValue prices computed using your own projected stats as input.
I will be adjusting the projections again before the start of the year. The links from the above images will go to pages showing the most recent data.