Much of the point of RotoValue dollar values is that the parameters of your league are relevant to how you should value players. When you start 2 catchers per team, top catchers are worth more than if you start just 1. Many players that have value in deeper leagues aren’t worth owning in shallower ones. My pricing model implicitly takes this into consideration.
But the site can customize even more than that. For a long time, the site has let RotoValue Analyst customers manually override the category weights, and also select extra categories to display for your league. Under the Settings menu, they’ll see a choice “RotoValue & Display”:
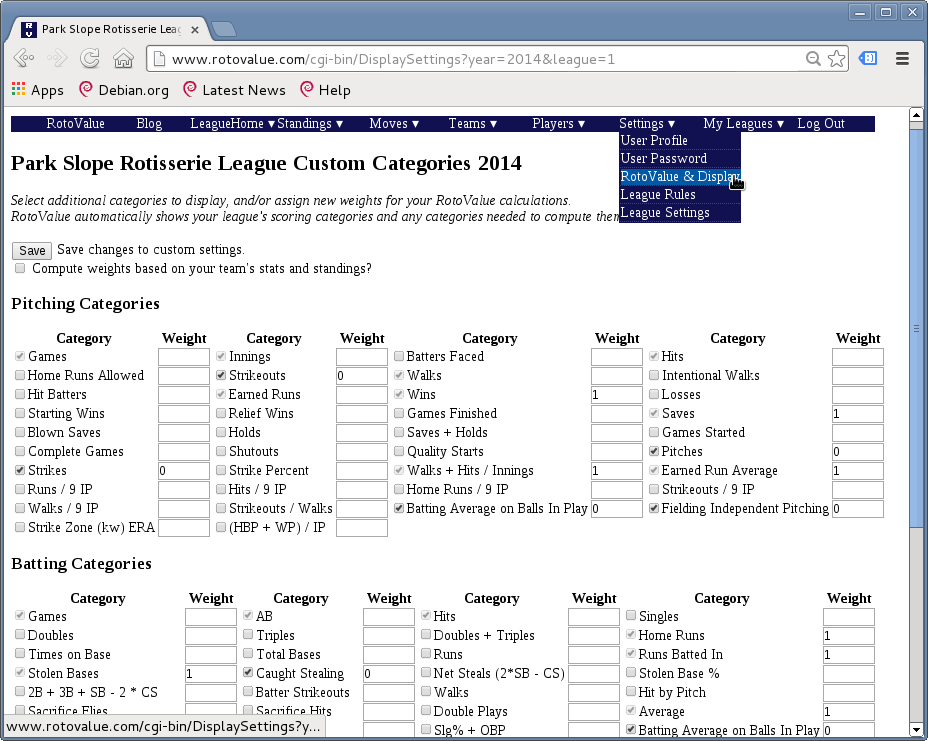
So if, for example, you’ve traded away all your closers, you could give the Saves category a weight of 0, and the RotoValue prices for your league would adjust to reflect the fact that you no longer care about a category. Similarly if you have a seemingly insurmountable lead in a category, you could give it 0 weight, or if a category is very close, you could give it double, or even triple weight. This page lets you set the weights for the categories in any RotoValue calculations, helping you find free agents (or evaluate trades) that are more relevant to your team’s situation. You get to manually set whatever weights you want, or, by clicking on the Reset button at the bottom of that page, remove all custom settings, and revert to using the scoring weights for your league in price calculations.
To use the customized weights, though, you have to opt in, by going to the settings page and updating them. I’ve just added a checkbox at the top of the page, “Compute weights based on your team’s stats and standings?”. This can automate the process of determining weights for you. If you select this option, the code will look at projected standings for your league, as well as the players in the active lineup on your team, and it will see how close you are to other owners in each category. The closer you are to passing or being passed by other owners, the more weight I will give a category. And if you save with this box checked, the algorithm runs very early each morning, after the previous day’s games, to recompute new weights based on updated standings data (and lineup changes).
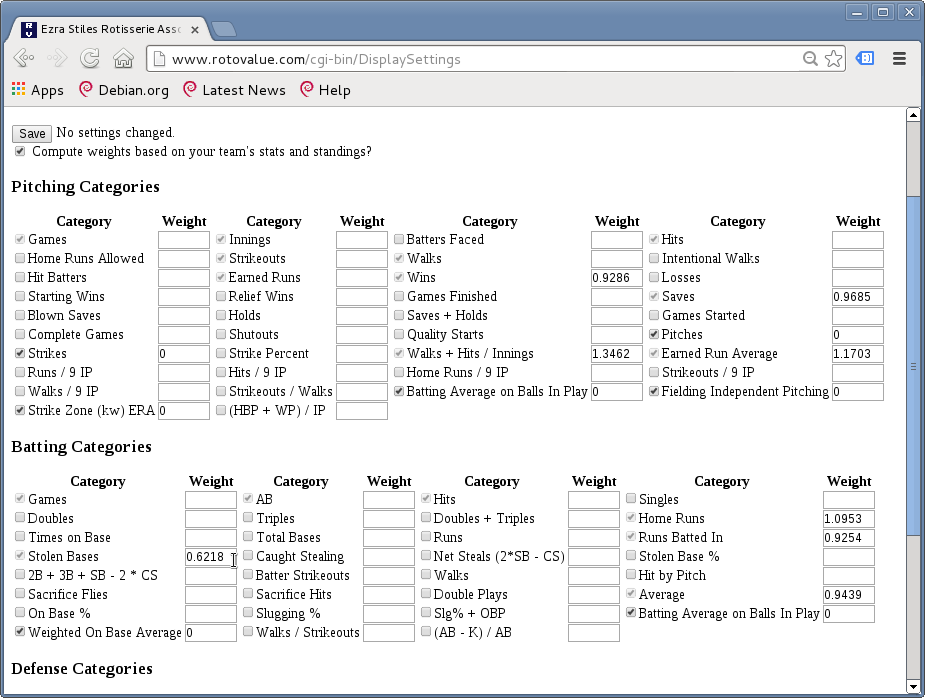 In this case my team projects near the bottom in Stolen Bases, and, more importantly, far from most other teams, so the algorithm gives that category the least weight, but WHIP projects to be the closest category, so it gives the most weight there. These different weights will affect RotoValue price calculations, guiding me towards players who are more likely to help my team, not only in general, but in the particular context of my league and opponents. The weights are scaled relative to the original league’s weight, so SB is given only 62% of its normal weight, while WHIP is given 134% of its weight. If your league weights certain categories differently for scoring purposes, then these calculations take that into account.
These auto-generated weights will tune RotoValue price calculations not only to the specifics of your league’s scoring and roster sizes, but also to the particular situation of your team and its current active roster relative to others. This information can help you make better decisions about pickups, trades, or even whom to put in your active lineup, and help you win your league.
Read on to see the how much difference this can have, and also details of the algorithm’s implementation.
So do these adjustments really make a difference in valuing players? Let’s compare two screenshots from the league I’ve shown above using the customized weights shown above. First, the regular prices for this league (categories and roster sizes are visible here):
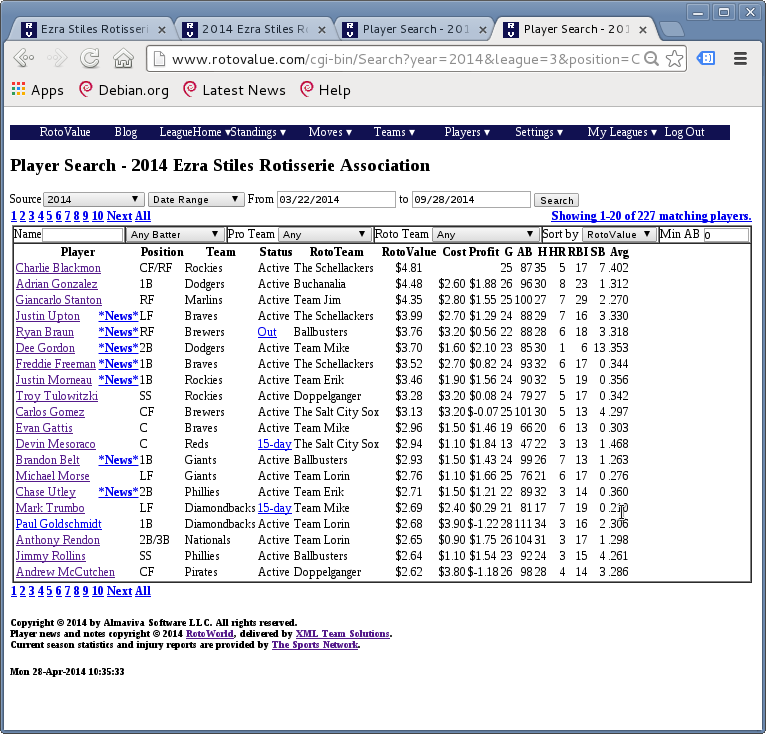
This league has a $30 salary cap, so $4 represents more than 13% of a team’s total budget (comparable to about $35 in a $260 salary cap league). Charlie Blackmon at $4.81 has been the most valuable batter, ahead of Adrian Gonzalez and Giancarlo Stanton, with Justin Upton a little further back. Dee Gordon at $3.70 is the best middle infielder.
Now contrast that list with one using the custom weights:
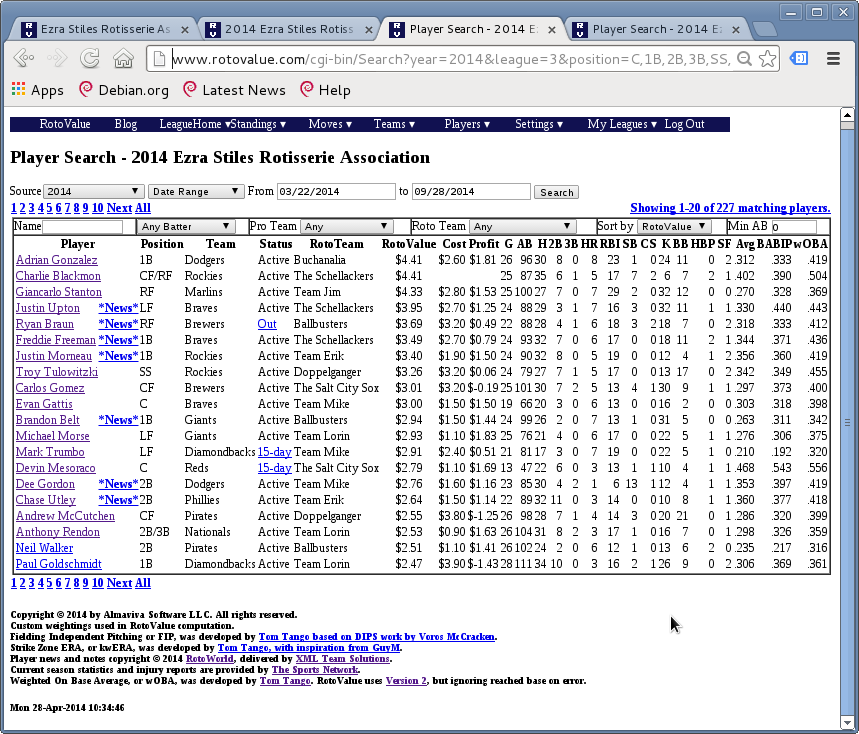
Here we see that with the much lower weighting for SB, Blackmon drops into a tie with Gonzalez, losing $0.40 of value (about $3.50 with a $260 cap). Gonzalez drops a bit too (while HR gain a bit, RBI, and Average get a little less weight), but not nearly as much.
Dee Gordon, who leads the NL in steals as I write this, falls much more, dropping nearly $1 of RotoValue (about $8 with a $260 cap). If you decided to give up on SB altogether, given it 0 weight, Gordon and Blackmon’s values would drop much further. Customized category weights can help you find better value for your team’s particular circumstances.
How do I compute these weights? I start of by computing projected standings for your league, a combination of the actual stats your team has put up so far and projected numbers for the rest of the season, based on your current lineup. This lets me see what league totals might be like at the end of the year.
What I want to do is figure out how likely you are to gain (or lose) points in a category given the projected standings, and add these estimates up by category. Those should be my raw weights.
I look at your active players, and compute a sample standard deviation in each category for your team’s players. I do this to capture how much variability your team’s numbers have. If you’ve traded away most players who steal, then your standard deviation for steals will be smaller than for other fantasy teams. For percentage categories, I’m taking the standard deviation of a delta – i.e. what would the league’s aggregate statistic be if I added a given player’s raw totals to that. This is how I adjust for playing time: a .300 batting average in 500 AB is worth more to a fantasy team than a .310 average in 200 AB.
Once I have a standard deviation for your team in each category, I compute an absolute value z-score for the difference between your team and every other team in the league in that category. If you’re projected to tie someone exactly, your z- score is 0 relative to that team, and it rises the further apart your projections are. The higher the standard deviation you have for the category, the lower the z-score is for a given difference between you and another team. Being 10 apart in RBIs may result in a lower zscore than being 2 apart in saves, because RBIs are usually more variable. This is especially likely if you’ve traded away all your closers, and none of your pitchers project to get any more saves.
What I want, though, is not the z-score itself, but the chance that you’ll pass a another team. For that, I use (1 – CDF(z-score)), where CDF is the cumulative normal distribution function. If you’re projected to tie exactly, your z-score is 0, so the CDF returns 0.5, and 1 – 0.5 is 0.5: I’m saying it’s a coin flip whether you’ll finish ahead of the other team or not. The larger the z-score, the closer to 1 the CDF value is, that is the less likely it is that your standings will change relative to that team in the category. Since I’m adding up 1 – CDF, the further ahead or behind someone else you are in a category, the less weight I give it, as that raw weight for the team approaches 0. In the extreme case of trading away all players who steal (or get saves, or HR), I also wind up adding 0, because the standard deviation for your team approaches 0, which makes the z-score very high even if you’re quite close in standings to other teams.
At this stage I could stop with these raw weights: the RotoValue computation only cares about category weights relative to each other, not their absolute values. But since I’m showing these weights on the RotoValue & Display settings page, I want them scaled in a meaningful way. So I first adjust the raw weights for each category so their totals add up to the number of categories. Finally, I multiply by the actual league’s weight for the category: usually this is just 1, but some leagues may count a category more (or less) than others, and so we need to reflect that.
So those are the details. I’m trying to project how likely you are to pass (or be passed by) other owners in a given category, and use that as a weight. And because this algorithm runs each morning for owners who enable it, it automatically adjusts for changes in your standings and lineup.
You can still choose to set your own weights manually, or to revert to the league weights by clicking reset. But when you’re looking at how a pickup or trade might affect your team, having prices customized to your team’s particular situation is another advantage.
The customized weighting is available to RotoValue Analyst customers. You can buy RotoValue Analyst at the RotoValue Store.